Showing posts with label debuggers. Show all posts

Monday, September 17, 2007

Debugger Tip #1: Leaner Binaries

Suppose that you are building a C or C++ Linux program that is going to be installed on tens or hundreds of your production machines. Since this software is not shipped to customers, you may as well leave the debug information in, to help you later with troubleshooting.

For complex programs the size of the debug information (especially for C++ programs) may be considerable, and it may impact your deployment time.

Hopefully you will not need the debug symbols as often. What if you could store the debug information on only one server instead of N?

Turns out you can pull this trick easily with the following bash script (which you can include in your Makefile as a post-build step):

#! /bin/bash
DBGFILE=DebugInfoServerNetworkMountedPath/$1.dbg
if objcopy --only-keep-debug $1 $DBGFILE; then
#strip -d $1 # strip debug info, or strip everything:
strip $1
objcopy --add-gnu-debuglink=$DBGFILE $1
fi

That's it.

"But how is the debugger going to know how to locate the debug information, since we stripped it out?" one may ask.

Simple. The objcopy --add-gnu-debuglink step creates a special section inside the ELF executable, which will point to the (network) location of the debug information. Both GDB and ZeroBUGS know how to handle it transparently.

Wednesday, August 29, 2007

Debugging is A Crappy Job

My best metaphor to date that describes the relationship between programmers and debugging tools is inspired from a recent trip to McLendon Hardware (a local, smaller and characterful version of the ubiquitous Home Depot).

No matter that my only purpose in the store is to buy bulbs, conduit, paint, or whatever supplies are needed for my weekend home maintenance project; I always always always end up wandering in the power tools section. Sounds familiar? If you are a normal male, it should. Pickup trucks. V8 Engines. The Niagara processor. Power tools. Got to love them.

For those of us with a geeky side, the enumeration may also include Power Books, cool programming languages, and Turbo Compilers (some girly men may also like Emacs, floppy discs, and Windows Vista, but let that not disturb you for now).

The point is, nobody in their right mind ever goes to the local hardware store to check the new selection of plungers. Because this is the very definition of a debugger: a tool to get the nasty job done (then swiftly hidden under the sink so visitors don't see it).

So what if one day your hardware store starts selling power plungers? Maybe even reversible ones? You may end up spending more time debugging.

Release early, release often!

Sunday, August 26, 2007

D Programming Language Conference: A Blast

I have not had much time for blogging lately. Terribly busy with getting the ZeroBUGS code up to snuff, fixing bugs, preparing my speech for the first D Developers' Conference, and Real Life (tm) in general.

The Conference (sponsored by Amazon.com, and organized by amazonian extraordinaire Brad Roberts) was a great success. See here and here.

The third day of the conference was a hands-on session of language design. Most of the stuff that Andrei Alexandrescu and Walter Bright drew on the whiteboard went way over my head. Thomas Kuhne sat next to me and quickly hacked his demangler for the D Language, to better integrate with my debugger.

Cool ideas for the future of the language and its support libraries filled the air, so I would not be surprised if by next year's conference the D Programming Language makes it into mainstream.

Friday, June 08, 2007

Worse is worse

Last week I presented my work on the ZeroBUGS debugger at Amazon.com. I started my talk by saying that the debugging support in Linux is in line with the worse is better principle: the building blocks are rudimentary for the sake of keeping the implementation simple.

For example, there is no native BreakpointEvent notification. Rather, the debugger implementer needs to keep track of all breakpoints; if a SIGTRAP occurs at the address where an active breakpoint exists, then it is most likely because the said breakpoint was hit.

Another solution is to use PTRACE_GETSIGINFO (available since kernel 2.3.99) and inspect the siginfo_t structure:

struct siginfo_t {
int si_signo; /* Signal number */
int si_errno; /* An errno value */
int si_code; /* Signal code */
pid_t si_pid; /* Sending process ID */
uid_t si_uid; /* Real user ID of sending process */
int si_status; /* Exit value or signal */
clock_t si_utime; /* User time consumed */
clock_t si_stime; /* System time consumed */
sigval_t si_value; /* Signal value */
int si_int; /* POSIX.1b signal */
void *si_ptr; /* POSIX.1b signal */
void *si_addr; /* Memory location which caused fault */
int si_band; /* Band event */
int si_fd; /* File descriptor */
}


For a SIGTRAP signal, the si_code field may be TRAP_BRKPT, in which case we know that the program hit a breakpoint.

At any rate, it is up to the debugger application to create higher-level abstractions, based on signals and ptrace notifications.

Linux is not the easiest nor most pleasant system to program on, but the implementation is so simple a child could understand it. Ahem.


Tuesday, February 20, 2007

Debugger Breakpoints

An overview of breakpoints, as implemented in the ZeroBugs debugger for Linux.

Breakpoints are central to the ZeroBugs debugger engine layer. Breakpoints can be set by the user, or by the debugger for internal purposes (such as detecting the creation of new threads).

Physical vs. Logical


Breakpoints can be classified in several ways. One categorization distinguishes between "logical breakpoints" and "physical breakpoints". What this means is that not all the breakpoints that you have inserted in the program are physically there, but the debugger will support the illusion that they are; reality is the realm of physical breakpoints, and logic is derived off perception. So if you perceive a breakpoint as being inserted in the debugged process, it is logically there, even though, physically, the debuggee has not been affected.

Let's consider a couple of examples, to help bring the discussion out of the philosophical realm:

  1. The user inserts a breakpoint at the beginning of a function that is not loaded into memory yet, because it lives in a shared library that has not been mapped into the debugge's memory space (just yet). The debugger nicely shields the user from knowing such details, and may say: "OK. I don't know what the address in memory of function `abc' is; but I know that it is implemented inside the dynamic library libabc.so; I will keep this in mind, so that if I later detect that libabc.so is loded, I will insert the breakpoint. "


  2. Another case may be that the debugger has inserted a breakpoint at the beginning of the pthread_create() function, to internally keep track of newly created threads. The user wants to insert a breakpoint at the same address, and does not need to know that a physical breakpoint is already there. The debugger associates two logical actions with the same physical breakpoint: one that internally updates the list of debugged threads, and another one that initiates an interaction with the user.


The logical breakpoints are implemented as actions associated with physical breakpoints. Each physical breakpoint maintains a list of actions. An action may be temporary (or once-only), which means that it gets discarded after being executed once. Once-only actions are similar to UNIX System V signal handlers. Non-temporary actions are executed each time the physical breakpoint is hit -- similar to BSD signal handlers.

Algorithm for executing breakpoint actions


// Execute actions on given thread
void BreakPoint::execute_actions(Thread* thread)
{
// The list of actions associated with this
// breakpoint may change during
// the execution of actions, and thus the
// iterators may be invalidated:
// make a copy of the actions and cycle thru
// the copy, to be safe.
ActionList tmp(this->actions_);
ActionList::iterator i = tmp.begin();
for (size_t d = 0; i != tmp.end(); ++d) {
if (is_disabled(*i)) {
++i; continue;
}
// a temporary action returns false
if ((*i)->execute(thread, this)) {
++i;
}
else {
// remove it from the master list
ActionList::iterator j = actions_.begin();
advance(j, d); actions_.erase(j);
// remove it from tmp as well so that
// destruction is not delayed
i = tmp.erase(i);
}
}
}


Software vs. Hardware


The Intel 386/486/585/686 family of chips offers support for debugging, including breakpoints. The CPU has 6 debug registers: 4 for addresses, one for control, and one for status. Each of the first 4 can hold a memory address that causes a hardware fault when accessed.

In Intel's lingo, a "fault" is a hardware notification, or event, that happens when the CPU is about to access a memory address -- that is, before the access happens. An "exception" is a similar notification, only that it happens after the access has occurred.

Remember: Hardware breakpoints are faults, software breakpoints are exceptions.

The control register holds some flags that specify the type of access (read, read-write, execute) and some other bits; the status register is helpful for determining which breakpoint was hit, when handling a system fault.

Thanks to Operating System magic, the hardware breakpoints are multiplexed, so we can have as many as N times 4 hardware breakpoints per program, where N is the number of threads in the program.Hardware breakpoints have the advantage of being non-intrusive -- the debugged program is not modified. Another advantage is that they can be set to monitor data as well as code. A debugger may use a hardware breakpoint to detect that a memory location is being accessed.

Software breakpoints are implemented as a special opcode (INT 0x3) that is inserted in the code at location to be monitored.

Nicely enough, Intel has a dedicated opcode for breakpoints. Other CPUs (PowerPC, for example) do not have a special opcode; on those platforms software breakpoints are implemented by inserting an invalid code at the desired location.

Software breakpoints have the main drawbacks of being slow and intrusive. The debugged program has to be modified, and the debugger needs to memorize the original opcode at the modified location, so that the debuggee's code is restored when the breakpoint is removed. When a software breakpoint is hit, the instruction pointer needs to be decremented, and the original opcode restored. Then the debugged program has to be stepped out of the breakpoint. After the breakpoint is handled, the breakpoint opcode is reinserted.

On UNIX derivatives (such as Linux), a debugger does not manipulate the debugged program directly; rather, it uses the operating system as a middle man (via the ptrace or /proc API). This implies that every time the debugger reads or writes into the debuggee's memory space, a context switch from user mode to kernel mode happens.

Another disadvantage of soft breakpoints is that they can only monitor code. Software breakpoints cannot be used for watching data accesses.

What makes software breakpoints indispensable is that there's no limit to how many can be inserted. Hardware breakpoints are a very scarce resource (you can run out of the 4 of them quite fast); software breakpoints are intrusive and slower, but can be used abundantly.

The design decision in my debugger is to use software breakpoints for user-specified breakpoints, and prefer hardware breakpoints for internal purposes. Watchpoints (breakpoints that monitor data access) are implemented as hardware breakpoints.

An example of breakpoints maintained by the debugger internally is stepping over function calls. A breakpoint is inserted at the location where the function returns, and control is given to the debuggee to run at full speed until the breakpoint is hit. The breakpoint is removed once it is hit, and the hardware resource can then be reused.

As a rule of thumb, the debugger employs the hardware support for cases where breakpoints are expected to be released after relatively short amounts of time. If no hardware registers are avaialable, the debugger falls back to using a software breakpoint.

Global vs. Per-Thread


Another categorization of breakpoints is by the what threads they affect in a multi-threaded program. A global breakpoint causes the program to stop, regardless of what thread has hit it. Per-thread breakpoints will stop the program only when reached by a given thread. Because all threads share the same code segment, a software breakpoint is also a global breakpoint, since
any thread that reaches the break opcode will stop.

The operating system creates the illusion of each thread running on its own CPU, therefore a hardware breakpoint may be private to a given thread.

A bit in the debug control register of the 386 chip can be used to control the global/per-task behavior of hardware breakpoints.

A thread ID can be added to the data structure or class that represents a software breakpoint. When the breakpoint is hit, the thread ID in the structure may be compared against the ID of the current thread. The behavior of a per-thread breakpoint can be emulated this way.

The debugger uses emulated breakpoints when it needs a hardware breapoint and none of the 4 debug registers is available.

Consider the case where the debugger uses a breakpoint for quickly stepping over function calls. The debugged program must stop only if the breakpoint at the function's return address is hit by the same thread that was current when the user gave the "step over" command.

Sunday, January 21, 2007

AMD64 Dual Core, HP, Linux and VMWARE

How nice (if at all) to the above play with each other?

I work two jobs. I program using C++ on Windows as my day job, and I am working on my own Linux-based startup at night (doubles as my hobby, too). In both worlds, 64-bit computing is the growing trend. But while at work the Windows 2003 Server 64-bit edition runs happily on the dependable Opteron-based workstation from HP, my private experience is not as successful.

I have a Pavilion a810n that I bought in January of 2005 (added 512 MRam since) and it runs Fedora Core 5, x86_64 edition. So far, so good. Stable as a rock. On top of it, I run VMWare so that I can simulate 32-bit environments running Fedora 4, 5, and 6, respectively. All stable and fun.

But I cannot run a 64-bit machine in the VMWare, because the CPU is not "version D, or later"... whatever the heck that means, it is not related to the D Programming Language (which I hope to fully support in Zero, one day).


[cristiv@newfoundland ~]$ cat /proc/cpuinfo
processor : 0
vendor_id : AuthenticAMD
cpu family : 15
model : 12
model name : AMD Athlon(tm) 64 Processor 3300+
stepping : 0
cpu MHz : 2400.000
cache size : 256 KB
fpu : yes
fpu_exception : yes
cpuid level : 1
wp : yes
flags : fpu vme de pse tsc msr pae mce cx8 apic sep mtrr pge mca cmov pat pse36 clflush mmx fxsr sse sse2 syscall nx mmxext lm 3dnowext 3dnow up
bogomips : 4823.30
TLB size : 1024 4K pages
clflush size : 64
cache_alignment : 64
address sizes : 40 bits physical, 48 bits virtual
power management: ts fid vid ttp


So I hit the coffers and bought a dual core laptop, to build my product on it (I just want to support as many distros as possible). Mandriva 2007 is the only distro that runs without hanging randomly on my HP dv6000z lappy. So far, point for French Engineering, and bad bad karma for Fedora and Ubuntu (which utterly suck on said laptop, both hanging tight as a drum).

VMWare seems to emulate 32-bit architectures fine on top of Mandriva on the HP dv6000z laptop, but 64-bit architectures hang badly during install (tried tweaking the Options, did not work). I had consistently bad results while trying several versions of Open SUSE and one RHEL 4 AS 64-bit.

Because I am trying really hard to get out a build of the Zero Debugger for the x86_64 versions of Suse, I bit the bullet one more time, went to FRYS this Sunday and got a HP Pavilion a1600n... Between waiting for AMD's Barcelona chip to come out and getting an unexpensive machine that will become obsolete the next month, I chose the later.

While I am ranting here, the jury is still out, running memory tests:) I am anxious to see how well 64-bit Suse installs natively on this machine.

Monday, January 08, 2007

Zero Debugger News


The latest version of the Zero Debugger includes fixes for a couple of bugs reported by Christoph Borgolte (thank you, sir) and optimizations of the memory usage in symbol tables.

I have also played some more with the graphical installer script for Redhat 9 / RHEL (see installer.py in http://zero-bugs.com/8001/builds/zero-i686.010807.tgz).

Santa brought a license of the Intel Compiler 9.1, so I ran the test suite with it. The results are very satisfactory: Zero Debugger works great on binaries compiled with icc! The only (minor) quirk I found so far is with functions returning long double on the x86_64 platform, which require a special compiler command line flag to work correctly.

Sunday, October 29, 2006

Prototyping with Python


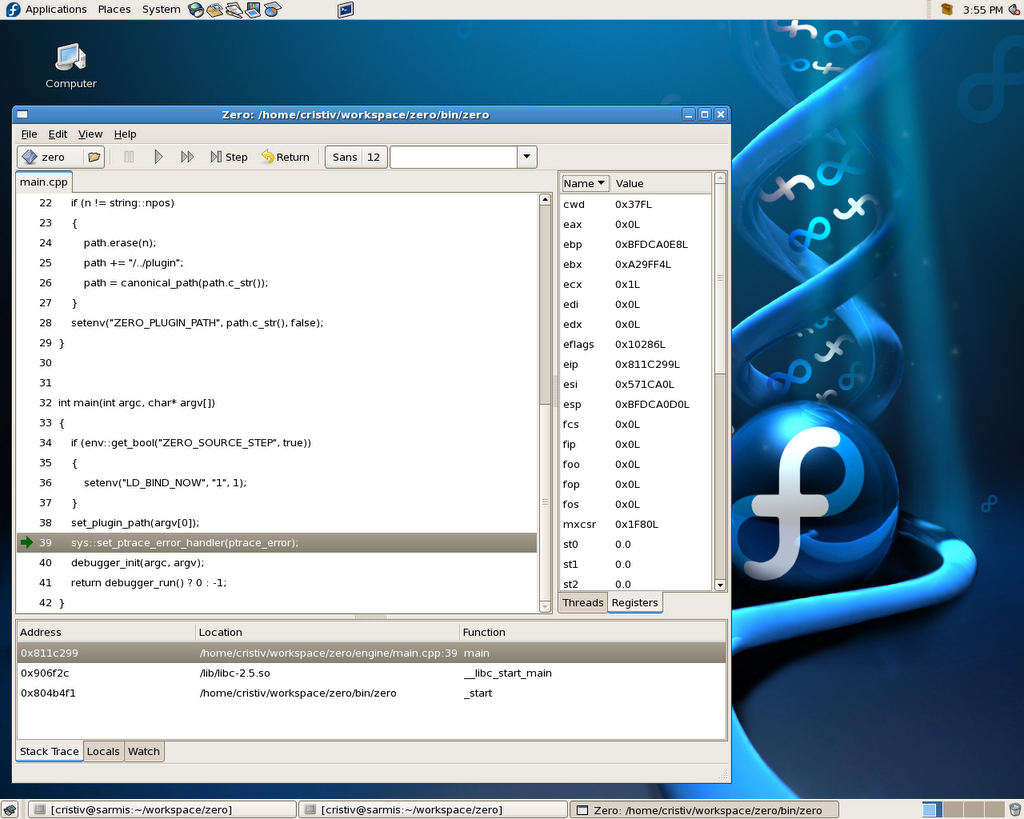
This is the new look and feel of the Zero Debugger User Interface that I was talking about in my previous post. I like the idea of having more "real estate" for the source code window.

The prototype is written using Glade and Python, which allow for rapid development, taking advantage of the PythonGate plugin that exposes the Zero API to Python.

Drop me a message if you would like to try out the Python code for yourself, I'll email it to you!

Monday, June 26, 2006

My debugger for C++/Linux finally went live this past weekend, at www.zero-bugs.com. Next, I will be testing it with the SUSE and Ubuntu distros.

The FreeBSD port requires quite a bit of work, because of the way multithreading is implemented in their kernel. I have stubbed out the support for FreeBSD in my debugger engine back in November, but the main focus has been Linux, and there is only one of me...

Also, following the development GNU C++ compiler and testing with the recent releases takes time, even with a suite of automated testing. Hopefully, now that I have an alpha release out, I will be getting feedback that will drive my testing / bug-fixing process; of course, "zero-bugs" is a dream :)

Last edit: Mon, Feb 19 2007
Wow! Time really flies like an arrow (and fruit flies like a peach).

Since the ZeroBugs debugger was first published on the internet, I have added crucial features such as Python scripting, tabbed code views, customizable hot keys, and have fixed ... er... more than zero bugs; went thru several Linux distros, and met some interesting people in the process.
Time goes by so fast when one is busy!